As a trader, you’re always hunting for that edge in the changing financial markets. Market analysis tools act like a secret weapon, giving you real-time data and visuals to spot emerging trends. Like a crystal ball, these tools reveal potential trading opportunities and patterns, empowering your technical analysis game.
But that’s not all! These nifty tools also help with risk management, allowing you to implement strategies that match your risk tolerance. It’s like having a safety net while you soar.
Imagine driving a race car without gauges or mirrors – pretty risky, right? Market analysis tools are your all-seeing dashcam, keeping you informed and in control. Don’t let the competition leave you in the dust; unlock the power of these tools and turbocharge your trading skills!
Need some examples? Check out popular platforms like TradingView (https://www.tradingview.com/) and MetaTrader (https://www.metaquotes.net/). These user-friendly tools pack a punch with customizable charts, indicators, and real-time data feeds. It’s like having a trading guru whispering in your ear.
Access Real-Time Data

To make smart trading choices, you need access to live market data. Market analysis tools give you this crucial info, keeping you up-to-date on price changes, trading volumes, and news that could impact your investments.
Without live data, you’re basically trading blindfolded, relying on outdated info that may no longer reflect reality. This puts you at a huge disadvantage compared to traders with access to live data feeds. You’ll miss out on opportunities and may make bad decisions based on old info, leading to suboptimal trades.
Live data lets you react quickly to sudden market shifts, allowing you to adjust positions or exit trades fast. This is key in fast markets where prices can change rapidly. Being behind can cost you big losses – it’s like trying to win a race with a flat tire!
Imagine a doctor operating based on a patient’s outdated file instead of their current vital signs. Or a pilot flying blind without up-to-date weather and traffic data. In trading, having the latest market pulse is just as critical.
So don’t get left behind – invest in tools that give you access to real-time market data feeds from reliable sources.
With live data at your fingertips, you can trade with confidence, seize opportunities, and adapt swiftly to changing conditions. Stay ahead of the curve!
Visualize Market Trends
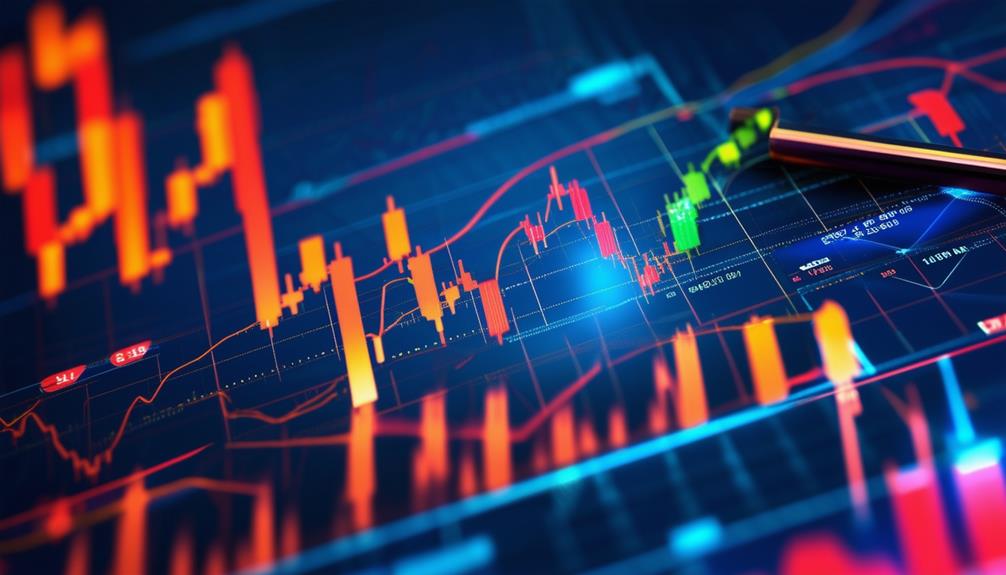
Visualizing market trends through interactive charts lets you spot patterns and potential buy/sell signals quickly. The intuitive tools overlay technical indicators like moving averages or MACD, enhancing your analysis. Candlestick charts vividly show price action, while line and bar charts offer a cleaner view. You can zoom in or out to analyze different time frames, from intraday to long-term, helping you make informed trading decisions based on your strategy.
Many platforms offer customizable layouts, allowing you to arrange multiple charts side-by-side for seamless analysis across different assets or markets. This comprehensive visual representation empowers you to assess overall market sentiment, pinpoint potential support or resistance levels, and execute trades confidently. Visualizing market data is like having a crystal ball – it gives you an edge in navigating the ever-changing financial markets.
Think of it this way: charts and graphs are like maps for traders. They help you see where prices have been, identify potential roadblocks (resistance levels), and plan your route (entry/exit points). And just like a good map, quality visuals make complex information easy to understand at a glance.
The key is to use visuals that resonate with your trading style. Are you a swing trader? Candlestick charts might be your jam, highlighting price momentum. Or maybe you’re a trend follower – in that case, overlay some moving averages to spot directional shifts. The possibilities are endless, and the right visuals can be game-changers.
Identify Trading Opportunities
With market trends visualized, you’re ready to take advantage of trading opportunities. Charts and indicators help you spot good times to buy or sell. You can find support and resistance levels, trend lines, and patterns that show potential reversals or continuations. This insight helps you time trades better and manage risk effectively.
Market analysis tools also let you test trading strategies on past data. By seeing how strategies performed historically, you can tweak them and find which setups work best. This systematic approach removes guesswork from trading, so you can trade confidently, knowing your strategies have been thoroughly tested.
Technical indicators like moving averages, oscillators, and volume indicators can highlight potential trades too. For example, if price action and an oscillator diverge, it could signal an upcoming reversal. Mastering these tools equips you to consistently spot high-probability trade setups and capitalize on them.
Much like a hunter tracking prey, you need to keep your eyes peeled for subtle signs and signals in the market. The more experienced you become, the better you’ll recognize patterns that spell opportunity. Just don’t get caught daydreaming – the markets wait for no one! With diligent analysis and a keen eye, you’ll be trading circles around the competition in no time.
Conduct Technical Analysis
Technical analysis lets you study charts and data to spot market trends and patterns. You’ll examine price movements, trading volumes, and indicators like trend lines, moving averages, RSI, and MACD. These tools reveal support/resistance levels, momentum, and overbought/oversold conditions – helping you decide when to buy or sell.
Like a detective, you’ll analyze clues across different timeframes – from intraday charts to weekly or monthly views.
Technical analysis alone can’t predict surprises like major news. But combined with research on a security’s underlying value drivers, it reveals current market sentiment and optimal trade setups based on historical precedents.
Picture a surfer studying wave patterns. Just as they read the ocean’s movements to catch the perfect wave, you’ll learn to interpret market ebbs and flows.
With practice, you too can ride price trends like a pro!
Sources: https://www.investopedia.com/terms/t/technicalanalysis.asp https://www.cmtassociation.org/about-us/what-is-technical-analysis/
Manage Risk Effectively
Risk management keeps your money safe when trading. It prevents big losses, so you can trade with confidence. Market analysis tools help you manage risk well – don’t ignore them!
Indicators like the Average True Range (ATR) show how much a stock moves daily. This lets you set smart stop-loss orders based on recent swings. Trailing stop-losses lock in profits as your trades go up. Position sizing tools ensure you don’t bet too much on one trade – avoiding catastrophic losses. Backtesting checks if a strategy worked in the past across different markets. So you know the risks beforehand. Real-time monitoring tracks your open trades so you can adjust quickly.
Like wearing a seatbelt, smart risk management protects you while trading. Use tools to control your exposure, cut losses fast, and let winners run. This greatly improves your chances of making money over time. It’s like having insurance for your trading account!.
Automate Trading Strategies
Automating trading strategies helps you trade quickly and calmly, without getting emotional. You use market analysis tools to program your strategies into an automated system. This system watches the markets and trades based on your rules. It avoids human mistakes and lets you profit from fleeting chances you’d miss with manual trading.
But automating strategies isn’t a ‘set it and forget it’ situation. You have to keep an eye on your automated systems and tweak them when markets change. Test your strategies on past data first to check if they really work before trading live. Also, use techniques like stop-losses and position-sizing to protect your money.
Automating saves time, cuts emotional biases, and lets you execute strategies consistently. But test systems thoroughly and monitor them closely for best results. It’s like having a robot trader working for you 24/7!
Picture this – you’re on vacation, sipping a margarita by the beach. Your automated trading system is diligently monitoring the markets, executing trades per your proven strategies. No need to stress or stare at charts all day. Just relax and let your automated soldier do the hard work!
Of course, you can’t completely neglect it. Regular check-ins, tweaks, and risk management safeguards are crucial. But automation frees you from the daily grind of manual trading. It’s the best of both worlds – consistent, unemotional trade execution plus the flexibility to enjoy life.
Backtesting and Optimization
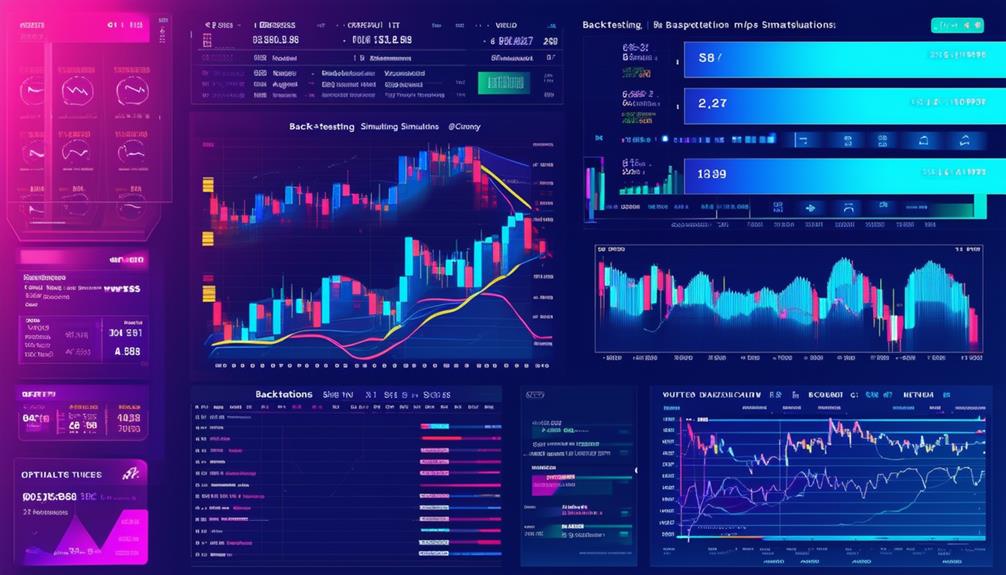
Imagine you’re getting ready to launch an automated trading strategy. Before you put real money on the line, you’ll want to test it thoroughly using historical data. This process is called backtesting. It’s like taking your strategy for a practice run to identify any flaws or areas for improvement.
Backtesting involves feeding your strategy past market data and seeing how it would have performed. It’s a crucial step that can save you from costly mistakes down the road. Think of it as a dress rehearsal before the big performance.
But backtesting alone isn’t enough. You’ll also need to optimize your strategy to make sure it’s operating at its best under different market conditions. Optimization means adjusting the strategy’s settings and parameters to find the perfect combination for maximum profits.
It’s like fine-tuning a race car – you want to tweak every aspect until it’s running smoothly and efficiently. This optimization process can be complex, but don’t worry – there are specialized tools that can lend a hand.
Many market analysis platforms offer powerful backtesting and optimization features. You can load historical data, define your strategy’s rules, and run simulations to see how it holds up. Some tools even use advanced algorithms to automate the optimization process, saving you time and effort.
By leveraging these tools, you can gain valuable insights into your strategy’s strengths and weaknesses. It’s like having a team of expert mechanics working behind the scenes to ensure your trading engine is running at peak performance.
With a well-tested and optimized strategy, you’ll have the confidence to dive into the markets with a solid game plan. Just like a seasoned athlete, preparation and practice are essential for success. So take the time to backtest and optimize – your future trading profits will thank you.
Enhance Decision-Making
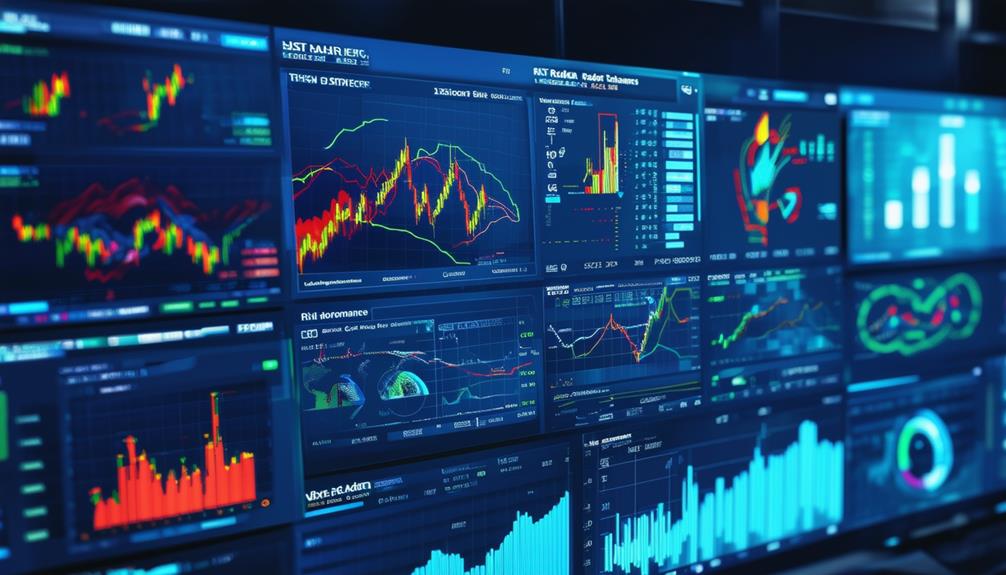
Spot-on decisions drive trading profits. Market analysis tools give you the data to make smart moves, not guesses. You get real-time market info, charts, and analytics. With these, you can find ideal trade entry and exit timings, manage risks, and fine-tune strategies.
These tools show trends through charts, numbers, and patterns. Technical indicators like moving averages and oscillators help uncover emerging market moves. It’s like having a crystal ball, but based on facts not fortune-telling!
Testing strategies on past data lets you see what worked before tweaking them. As markets change, staying flexible by analyzing data keeps you ahead. It’s the difference between blindly hoping and making educated, profitable trades.
Imagine trying to learn tennis just by hitting balls. Analytics are like having a coach breaking down every shot, helping you improve with each swing. The more info you have, the better your decision-making muscles become.
Picture this: You’re playing a video game, but your character can only move left or right, not seeing what’s ahead. Analytics give you the full map, hazards included, so you can navigate skillfully. Who’d struggle blindly when you can have x-ray market vision?
The proof is in the data pudding. Traders consistently utilizing analytics outperform those just winging it [https://www.investopedia.com/articles/trading/11/leading-technical-indicators.asp]. It’s like having the answers to the test, legally! Why handicap yourself without tapping into market intelligence?